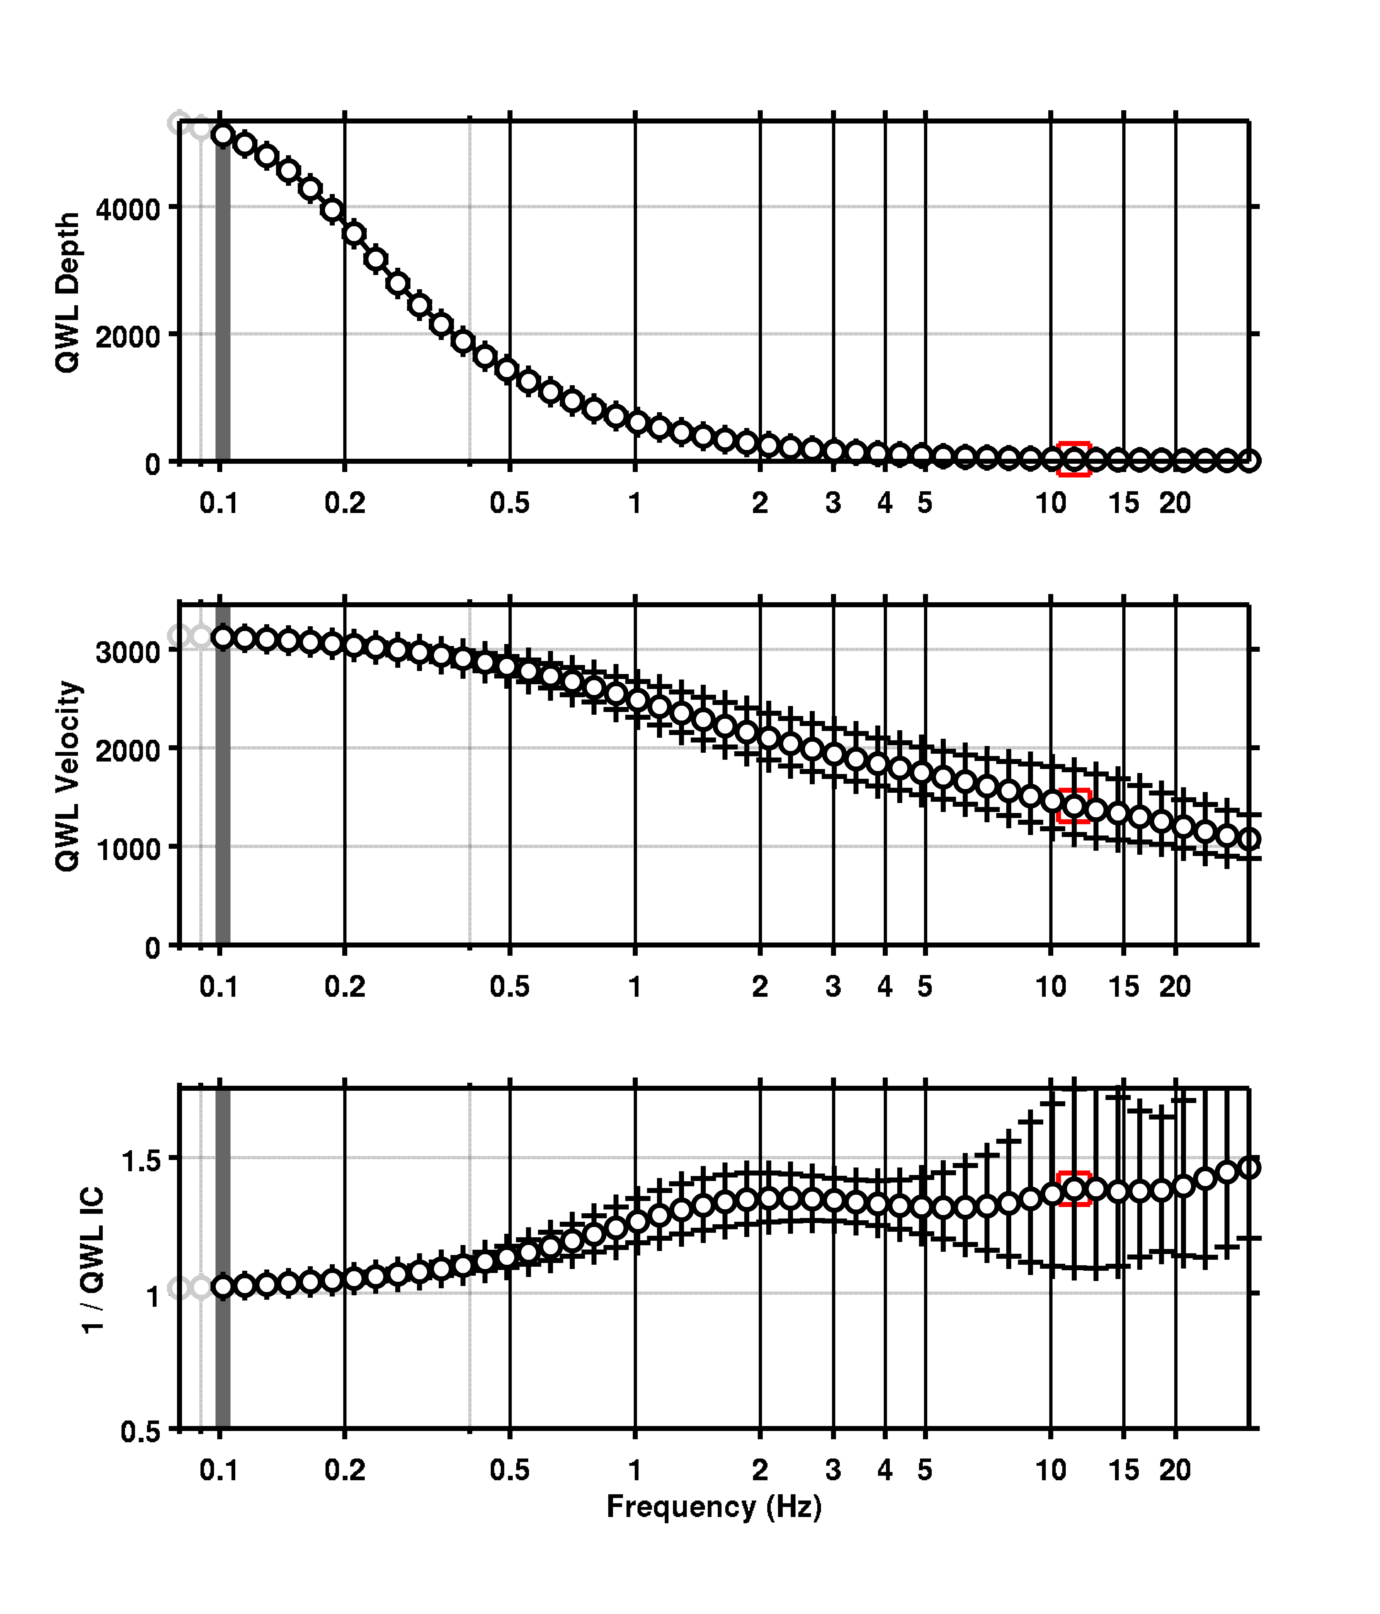
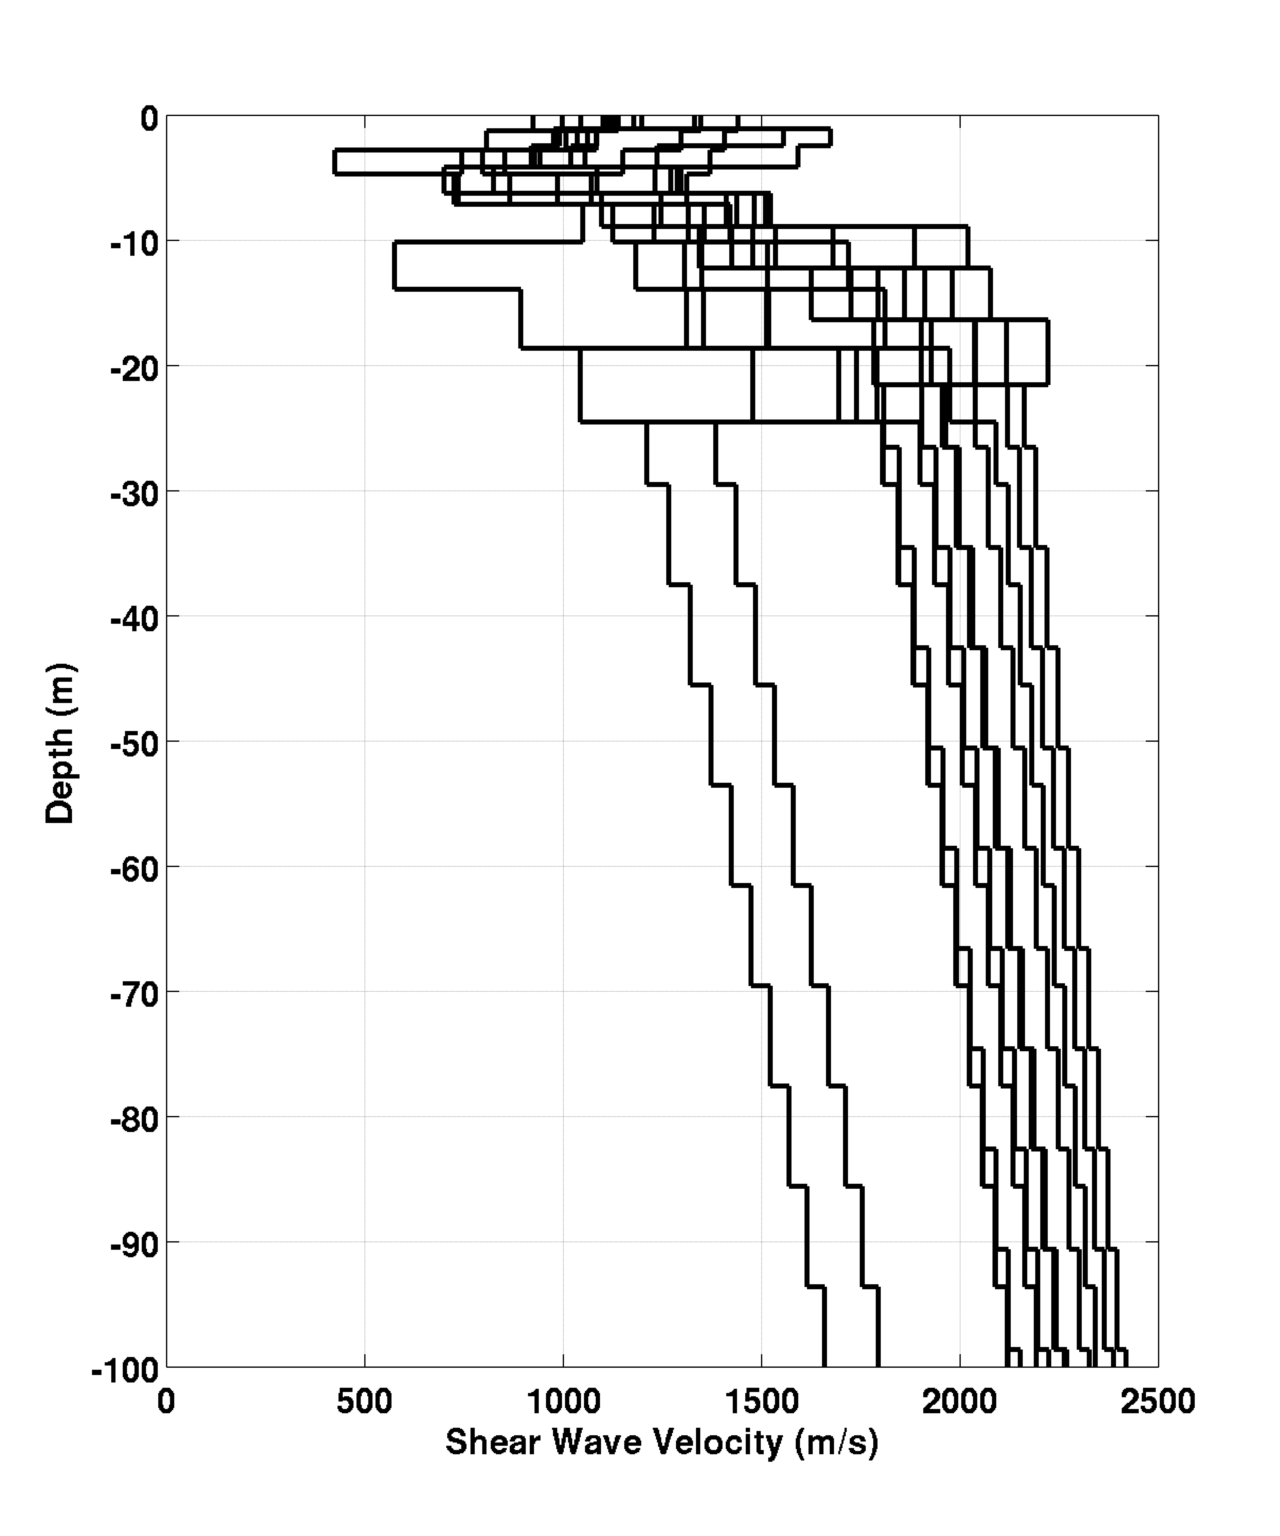
Site Characterization

Averaging Depth (m)
Average Travel Time Velocity Vsz (m/s)
Velocity Uncertainty (m/s)
5.0 1055 201
10.0 1119 159
15.0 1218 191
20.0 1311 208
25.0 1384 211
30.0 1440 203
40.0 1526 196
50.0 1592 195
75.0 1710 196
100.0 1797 197
150.0 1927 194
200.0 2028 188
QWL Picture

Quarter-wavelength representation of the velocity profiles. See Poggi et al. (2012). Characterizing the Vertical-to-Horizontal Ratio of Ground Motion at Soft-Sediment Sites. Bulletin of the Seismological Society of America, 102(6), 2741–2756.

Profile Picture
Z0.8 (m) 0.0

Z0.8 is the depth where the average of the profiles reach the velocity of 0.8 km/s

Z1 (m) 1.0

Z1 is the depth where the average of the profiles reach the velocity of 1 km/s,

Z1.5 (m) 12.0

Z1.5 is the depth where the average of the profiles reach the velocity of 1.5km/s

author
agency
last modified
file type
link
Geoexpert AG Swissnuclear 23-06-2014 07:32:47 Document 09SN_00Summary_Report.pdf
Geoexpert AG Swissnuclear 01-04-2015 09:40:28 Document 09SN_20WIMIS_Report.pdf
Donat Fäh SED 13-03-2024 09:04:14 Document Determination_of_Site_Information_for_Seismic_Stations.pdf
Valerio Poggi SED 01-04-2015 13:47:04 Document SED_Exteded_Profiles_20130822_FINAL.pdf